Business cycles
Some empirics
Below it is shown the dynamics of GDP of the UK from 1948 - 2011. The red line denotes the actual GDP and the black line denotes its long run trend. It can be seen that GDP is almost five times higher in 2011 compared with 1948. This basically means that the standard of living in the UK has grown considerably.
This growth, however, has been relatively cyclical. Even more, these cycles are very chaotic and do not show any regularity in depth or in length. One could wonder, what causes this kind of instability. Why does not GDP follow its long run trend? This is the main question that will be addressed on the following pages.
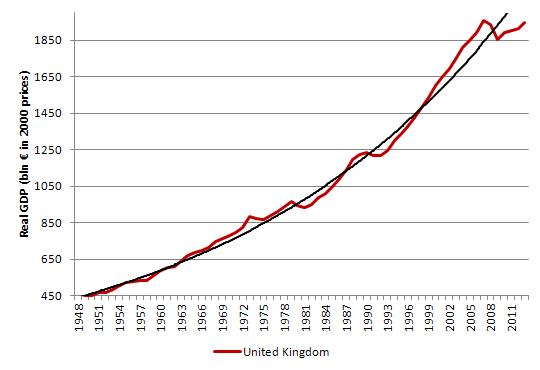
Figure 1. Real GDP growth in the UK
Source: Eurostat, 2012. Annual national accounts. [http://epp.eurostat.ec.europa.eu/portal/page/portal/national_accounts/data/database] 5.06.2012